Market Outlook
December 20, 2016
Market Cues
Domestic Indices
Chg (%)
(Pts)
(Close)
Indian markets are expected to open flat tracking the SGX Nifty.
BSE Sensex
(0.4)
(115)
26,375
Nifty
(0.4)
(35)
8,104
US Markets closed higher on Monday on light trading activity in light of the holiday
season as well as upcoming economic data. Most sectoral indices closed modestly
Mid Cap
(0.5)
(63)
12,174
upwards. The Dow Jones Trucking Index closed up by 1.2 percent recovering the
Small Cap
(0.5)
(56)
12,058
previous session’s losses. Significant gains were also made by the Dow Jones
Bankex
(0.3)
(57)
20,928
Software Index which closed up by 1.2 percent. Steel stocks came under pressure
and the NYSE Arca Steel Index down 2 percent.
Global Indices
Chg (%)
(Pts)
(Close)
The FTSE 100 had a mixed session that saw it recover from early losses to close
Dow Jones
0.2
40
19,883
mildly positive. Stocks such as Hikma Pharmaceuticals, Capita and BT Group were
Nasdaq
0.4
20
5,457
among the largest gainers for the session. Carnival fell by 1.11 percent after it was
downgraded to "Hold" from "Buy". Oil companies Royal Dutch Shell and BP Plc rose
FTSE
0.1
6
7,017
by 1.15 percent and 0.22 percent on positive developments.
Nikkei
(0.0)
(10)
19,392
Indian markets continued its fall for the fourth straight session on Monday on low
Hang Seng
(0.9)
(188)
21,833
volumes and concerns over higher oil prices and growing antagonism between the
Shanghai Com
(0.2)
(5)
3,118
US and China. Most sectoral indices closed in the red with the PSU Bank and Metal
indices falling by 1.08 and 0.97 percent respectively. The only index to close on
Advances / Declines
BSE
NSE
positive note was the Energy index which reported a gain of 0.59 percent, as the
Advances
1,073
601
government announced a rate hike in diesel and petrol prices.
Declines
1,598
1,020
News Analysis
Unchanged
170
69
Cyrus Mistry announces resignation from listed Tata Group companies
Glenmark to develop specialty drugs to address price erosion
Volumes (` Cr)
Detailed analysis on Pg2
BSE
2,423
Investor’s Ready Reckoner
NSE
13,299
Key Domestic & Global Indicators
Net Inflows (` Cr)
Net
Mtd
Ytd
Stock Watch: Latest investment recommendations on 150+ stocks
Refer Pg5 onwards
FII
255
(527)
26,751
MFs
290
136
38,322
Top Picks
CMP
Target
Upside
Company
Sector
Rating
(`)
(`)
(%)
Top Gainers
Price (`)
Chg (%)
Amara Raja Batt. Auto & Auto Ancill.
Buy
899
1,167
29.8
Aloktext
3
20.0
Alkem Laboratories Pharmaceuticals
Buy
1,632
1,989
21.9
Gsfc
96
9.0
HCL Tech
IT
Buy
825
1,000
21.2
Jppower
4
5.2
Power Grid Corp. Power
Buy
184
223
21.1
Navkar Corp.
Others
Buy
172
265
54.5
Rdel
55
3.8
More Top Picks on Pg3
Edelweiss
86
3.6
Key Upcoming Events
Previous
Consensus
Top Losers
Price (`)
Chg (%)
Date
Region
Event Description
Reading
Expectations
Manappuram
63
(5.9)
Dec 21 Euro Zone Euro-Zone Consumer Confidence
(6.1)
(6.0)
Bharatfin
604
(5.8)
Dec 21 US
Existing home sales
5.6
5.5
Dec 22 US
GDP QoQ (Annualised)
3.2
3.3
Oberoirlty
311
(5.5)
Dec 22 US
Initial Jobless claims
254.0
258.5
Nationalum
59
(4.2)
Dec 23 UK
GDP (YoY)
2.3
2.3
Eidparry
256
(4.2)
More Events on Pg4
As on December 19, 2016
Market Outlook
December 20, 2016
News Analysis
Cyrus Mistry announces resignation from listed Tata Group
companies
After a public and bitter eight-week boardroom battle, former Tata Sons chairman
Cyrus Mistry announced his resignationt from the boards of six listed Tata Group
companies, including Tata Motors and Indian Hotels. Mr. Mistry promised to take
his fight against the Tatas to a legal forum.
With the resignation of Cyrus Mistry, the EGMs of the five listed companies, (Indian
Hotels, Tata Motors, Tata Steel, Tata Chemicals and Tata Power), will not carry the
resolution to remove Mistry. Mr. Mistry was chairman of all these companies. But
the resolution to remove Nusli Wadia as an independent director of Tata Steel,
Tata Motors and Tata Chemicals would continue. Wadia has already sued the
Tatas for defamation and has charged the Tata’s of lapses in corporate
governance.
Glenmark to develop specialty drugs to address price erosion
Glenmark has decided to focus on developing specialty respiratory and
dermatology products as a part of its long-term growth strategy.
The drug maker released its strategic blueprint for the next decade on Monday
outlining an increased spending towards research and development and $300mln
in capex, focus on differentiated dosage forms and in-licensing of complex drugs.
Glenmark earns about 60 per cent of the revenue from domestic and the US
market. Glenmark chairman stated that the company has three specialty
respiratory products under clinical trials and that these drugs would be filed for
approval in the US in the next few years. Overall, R&D spend will increase from
around 9-10 percent of sales to 11 percent of sales. The company's US revenue
doubled from `1,213 cr to `2,420 cr in five years till FY16.
Economic and Political News
Domestic air traffic rises 22.45 percent YoY to 89.66 lakh passengers in
November 2016
Odisha Chief Minister Naveen Patnaik calls for implementation of investments
proposals of around `1.5 lakh cr over the next three years
Trai recommends limited free data access for rural subscribers
Government extends farm loan repayment by 2 months
Corporate News
Jindal Steel and Power Ltd (JSPL) plans additional `8,000cr capex for its
Odisha operations
Divi's Lab to shift `500cr greenfield project if Kakinada protest not resolved
Visa Steel to resume operations at Kalinganagar plant after getting clearance
from the State Pollution Control Board (SPCB)
Market Outlook
December 20, 2016
Top Picks ★★★★★
Large Cap
Market Cap
CMP
Target
Upside
Company
Rationale
(` Cr)
(`)
(`)
(%)
To outpace battery industry growth due to better
Amara Raja Batteries
15,361
899
1,167
29.8
technological products leading to market share gains in
both the automotive OEM and replacement segments.
Strong growth in domestic business due to its leadership in
Alkem Laboratories
19,513
1,632
1,989
21.9
acute therapeutic segment. Alkem expects to launch more
products in USA, which bodes for its international business.
The stock is trading at attractive valuations and is factoring
HCL Tech
1,16,382
825
1,000
21.2
all the bad news.
Back on the growth trend; expect a long term growth of 14%
Infosys
2,30,200
1,002
1,249
24.6
to be a US$20bn in FY2020.
Strong order backlog and improvement in execution would
Larsen & Tourbo
1,25,454
1,345
1,634
21.5
trigger the growth for the L&T
One of the largest pharma companies with strong
international presence. It has a rich pipeline of ANDAs
Lupin
66,559
1,475
1,809
22.7
which is also one of the largest among the generic
companies.
Going forward, we expect the company to report strong
Power Grid Corporation
96,340
184
223
21.1
top-line CAGR of ~16% and bottom-line CAGR of ~19%
over FY16-18 on back of strong capitalization guidance
Source: Company, Angel Research
Mid Cap
Market Cap
CMP
Target
Upside
Company
Rationale
(` Cr)
(`)
(`)
(%)
We expect the company would report strong profitability
Asian Granito
671
223
351
57.4
owing to better product mix, higher B2C sales and
amalgamation synergy.
Among the top 4 players in the consumer durables segment.
Bajaj Electricals
2,213
219
274
25.1
Improved profitability backed by turn around in E&P
segment. Strong order book lends earnings visibility.
Favourable outlook for AC industry augurs well for Cooling
Blue Star
4,365
457
634
38.7
products business which is outgrowing the market. EMPPAC
division's is likely to turn around on improving economy
With a focus on the low and medium income (LMI)
Dewan Housing Finance
7,564
242
350
44.9
consumer segment, the company has increased its presence
in tier-II & III cities where the growth opportunity is immense.
Strong loan growth backed by diversified loan portfolio and
adequate CAR. ROE & ROA likely to remain decent as risk of
Equitas Holdings
5,074
151
235
55.3
dilution remains low. Attractive valuations considering
growth.
Economic recovery to have favourable impact on advertising
& circulation revenue growth. Further, the acquisition of a
Jagran Prakashan
5,525
169
225
33.1
radio business (Radio City) would also boost the company's
revenue growth.
Speedier execution and speedier sales, strong revenue
Mahindra Lifespace
1,481
361
522
44.7
visibilty in short-to-long run, attractive valuations
We expect the company to report strong growth on back of
healthy growth in domestic branded sales (owing to
Mirza International
1,044
87
107
23.3
aggressive ad spend and addition in the number of EBOs &
multi-brand outlets [MBOs]) and healthy export revenues.
Massive capacity expansion along with rail advantage at
Navkar Corporation
2,446
172
265
54.5
ICD as well CFS augurs well for the company.
Strong brands and distribution network would boost growth
Siyaram Silk Mills
1,143
1,219
1,605
31.7
going ahead. Stock currently trades at an inexpensive
valuation.
Market leadership in Hindi news genre and no. 2 viewership
ranking in English news genre, exit from the radio business,
TV Today Network
1,566
263
385
46.7
and anticipated growth in ad spends by corporate to benefit
the stock.
Source: Company, Angel Research
Market Outlook
December 20, 2016
Key Upcoming Events
Global economic events release calendar
Date
Time
Country
Event Description
Unit
Period
Bloomberg Data
Last Reported Estimated
Dec 21, 2016
8:30PM
Euro Zone
Euro-Zone Consumer Confidence
Value
Dec A
(6.10)
(6.00)
8:30PM
US
Existing home sales
Million
Nov
5.60
5.50
Dec 22, 2016
7:00PM
US
GDP Qoq (Annualised)
% Change
3Q T
3.20
3.30
7:00PM
US
Initial Jobless claims
Thousands
Dec 17
254.00
258.50
Dec 23, 2016
3:00PM
UK
GDP (YoY)
% Change
3Q F
2.30
2.30
6:30AM
China
PMI Manufacturing
Value
Dec
51.70
--
Dec 27, 2016
8:30PM
US
New home sales
Thousands
Nov
563.00
575.00
Jan 1, 2017
8:30PM
US
Consumer Confidence
S.A./ 1985=100
Dec
107.10
108.75
Jan 2, 2017
2:25PM
Germany
PMI Manufacturing
Value
Dec F
55.50
55.50
Jan 3, 2017
3:00PM
UK
PMI Manufacturing
Value
Dec
53.40
53.30
2:25PM
Germany
Unemployment change (000's)
Thousands
Dec
(5.00)
(5.00)
Jan 4, 2017
2:25PM
Germany
PMI Services
Value
Dec F
53.80
53.80
Jan 6, 2017
7:00PM
US
Change in Nonfarm payrolls
Thousands
Dec
178.00
175.00
7:00PM
US
Unnemployment rate
%
Dec
4.60
4.70
Jan 8, 2017
China
Exports YoY%
% Change
Dec
0.10
--
Jan 9, 2017
China
Consumer Price Index (YoY)
% Change
Dec
2.30
--
Jan 10, 2017
India
Imports YoY%
% Change
Dec
10.40
--
3:00PM
UK
Industrial Production (YoY)
% Change
Nov
(1.10)
--
Jan 11, 2017
India
Exports YoY%
% Change
Dec
2.30
--
Jan 12, 2017
5:30PM
India
Industrial Production YoY
% Change
Nov
(1.90)
--
Jan 13, 2017
US
Producer Price Index (mom)
% Change
Dec
--
--
Jan 16, 2017
12:00PM
India
Monthly Wholesale Prices YoY%
% Change
Dec
3.15
--
Jan 17, 2017
3:00PM
UK
CPI (YoY)
% Change
Dec
1.20
--
China
Industrial Production (YoY)
% Change
Dec
6.20
--
China
Real GDP (YoY)
% Change
4Q
6.70
--
Jan 18, 2017
7:00PM
US
Consumer price index (mom)
% Change
Dec
0.20
--
3:30PM
Euro Zone
Euro-Zone CPI (YoY)
%
Dec F
0.60
--
7:45PM
US
Industrial Production
%
Dec
(0.44)
--
7:00PM
US
Housing Starts
Thousands
Dec
1,090.00
--
Source: Bloomberg, Angel Research
Market Outlook
December 20, 2016
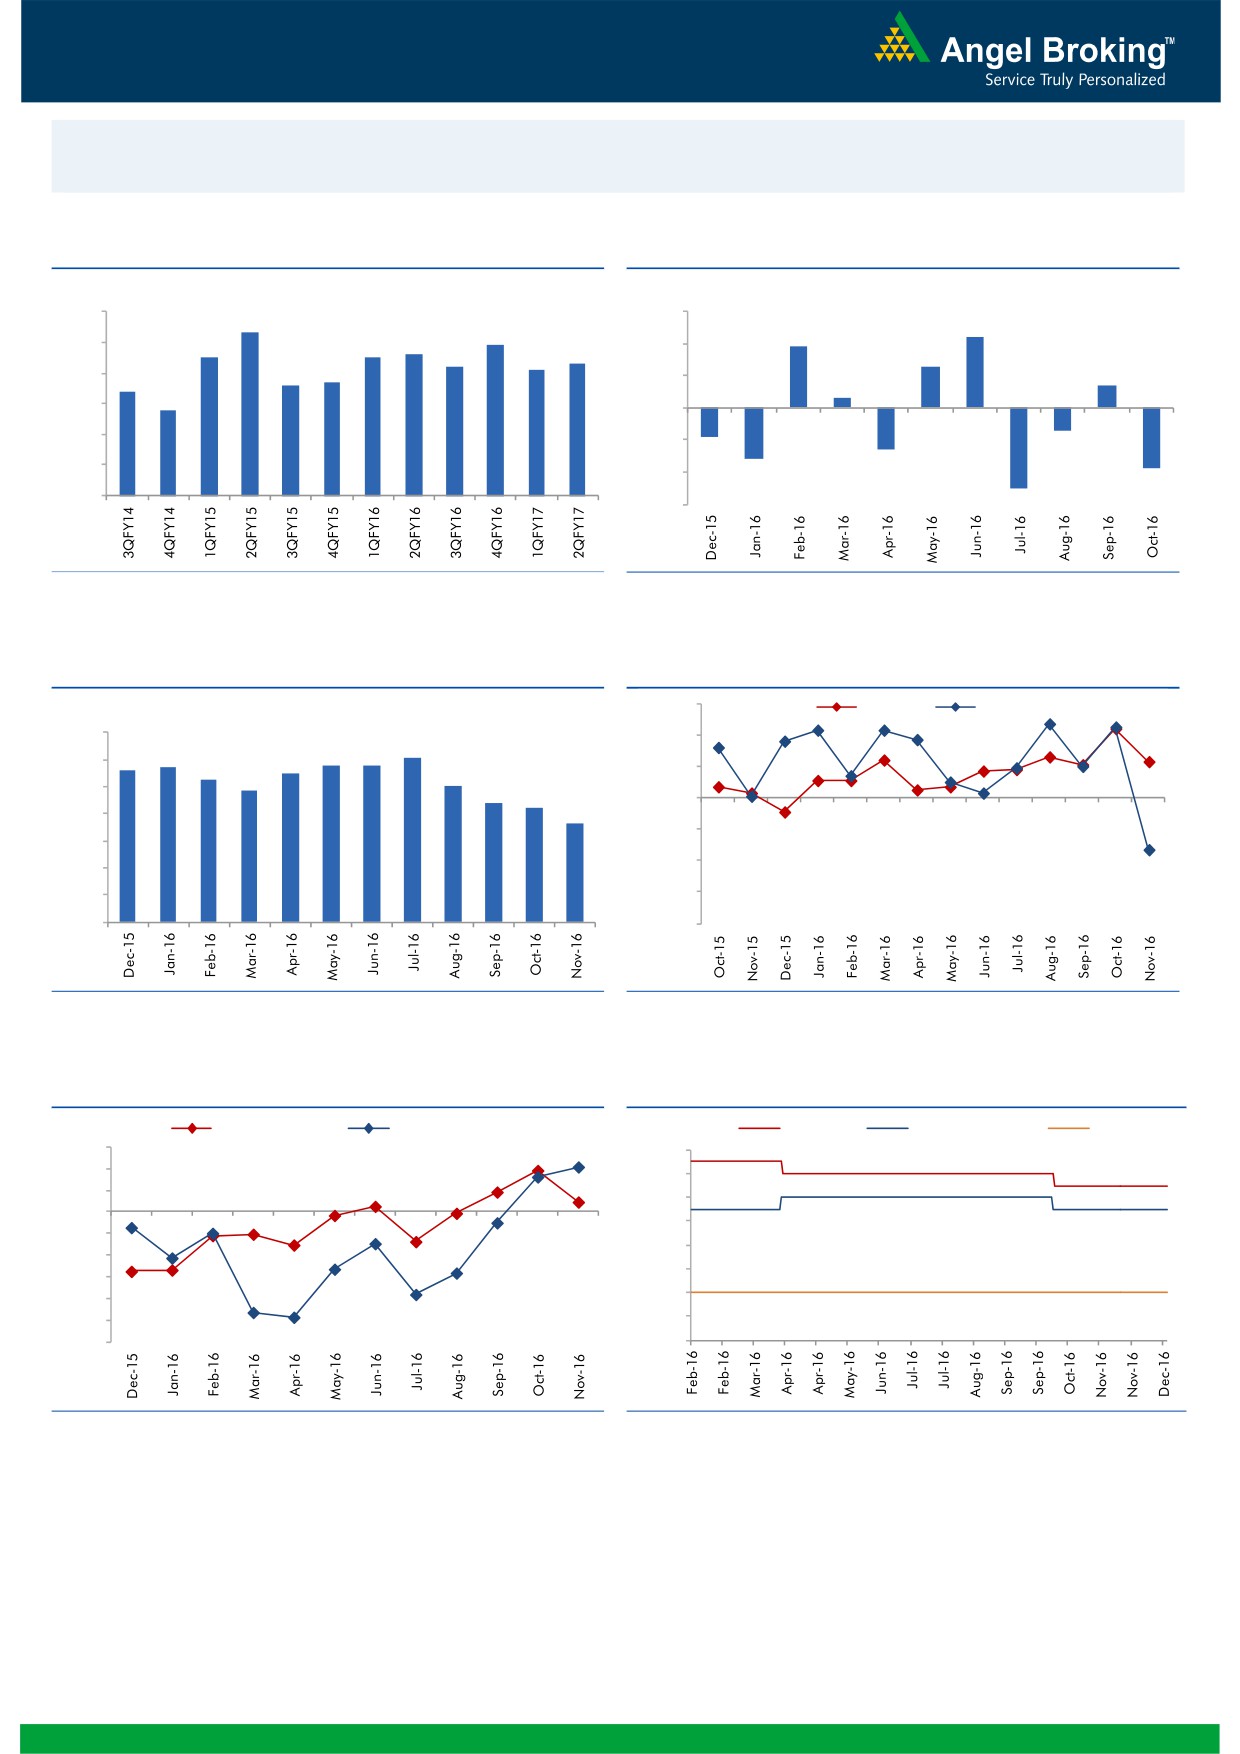
Macro watch
Exhibit 1: Quarterly GDP trends
Exhibit 2: IIP trends
(%)
(%)
9.0
3.0
8.3
2.2
7.9
1.9
7.5
7.5
7.6
8.0
7.3
2.0
7.2
7.1
1.3
6.6
6.7
0.7
7.0
6.4
1.0
0.3
5.8
6.0
-
5.0
(1.0)
(0.7)
(0.9)
4.0
(1.3)
(2.0)
(1.6)
(1.9)
3.0
(3.0)
(2.5)
Source: CSO, Angel Research
Source: MOSPI, Angel Research
Exhibit 3: Monthly CPI inflation trends
Exhibit 4: Manufacturing and services PMI
56.0
Mfg. PMI
Services PMI
(%)
7.0
54.0
6.1
5.6
5.7
5.8
5.8
6.0
5.3
5.5
5.1
52.0
4.8
5.0
4.4
4.2
50.0
3.6
4.0
48.0
3.0
46.0
2.0
1.0
44.0
-
42.0
Source: MOSPI, Angel Research
Source: Market, Angel Research; Note: Level above 50 indicates expansion
Exhibit 5: Exports and imports growth trends
Exhibit 6: Key policy rates
(%)
Exports yoy growth
Imports yoy growth
(%)
Repo rate
Reverse Repo rate
CRR
15.0
7.00
10.0
6.50
5.0
6.00
0.0
5.50
(5.0)
5.00
(10.0)
4.50
(15.0)
(20.0)
4.00
(25.0)
3.50
(30.0)
3.00
Source: Bloomberg, Angel Research
Source: RBI, Angel Research
Market Outlook
December 20, 2016
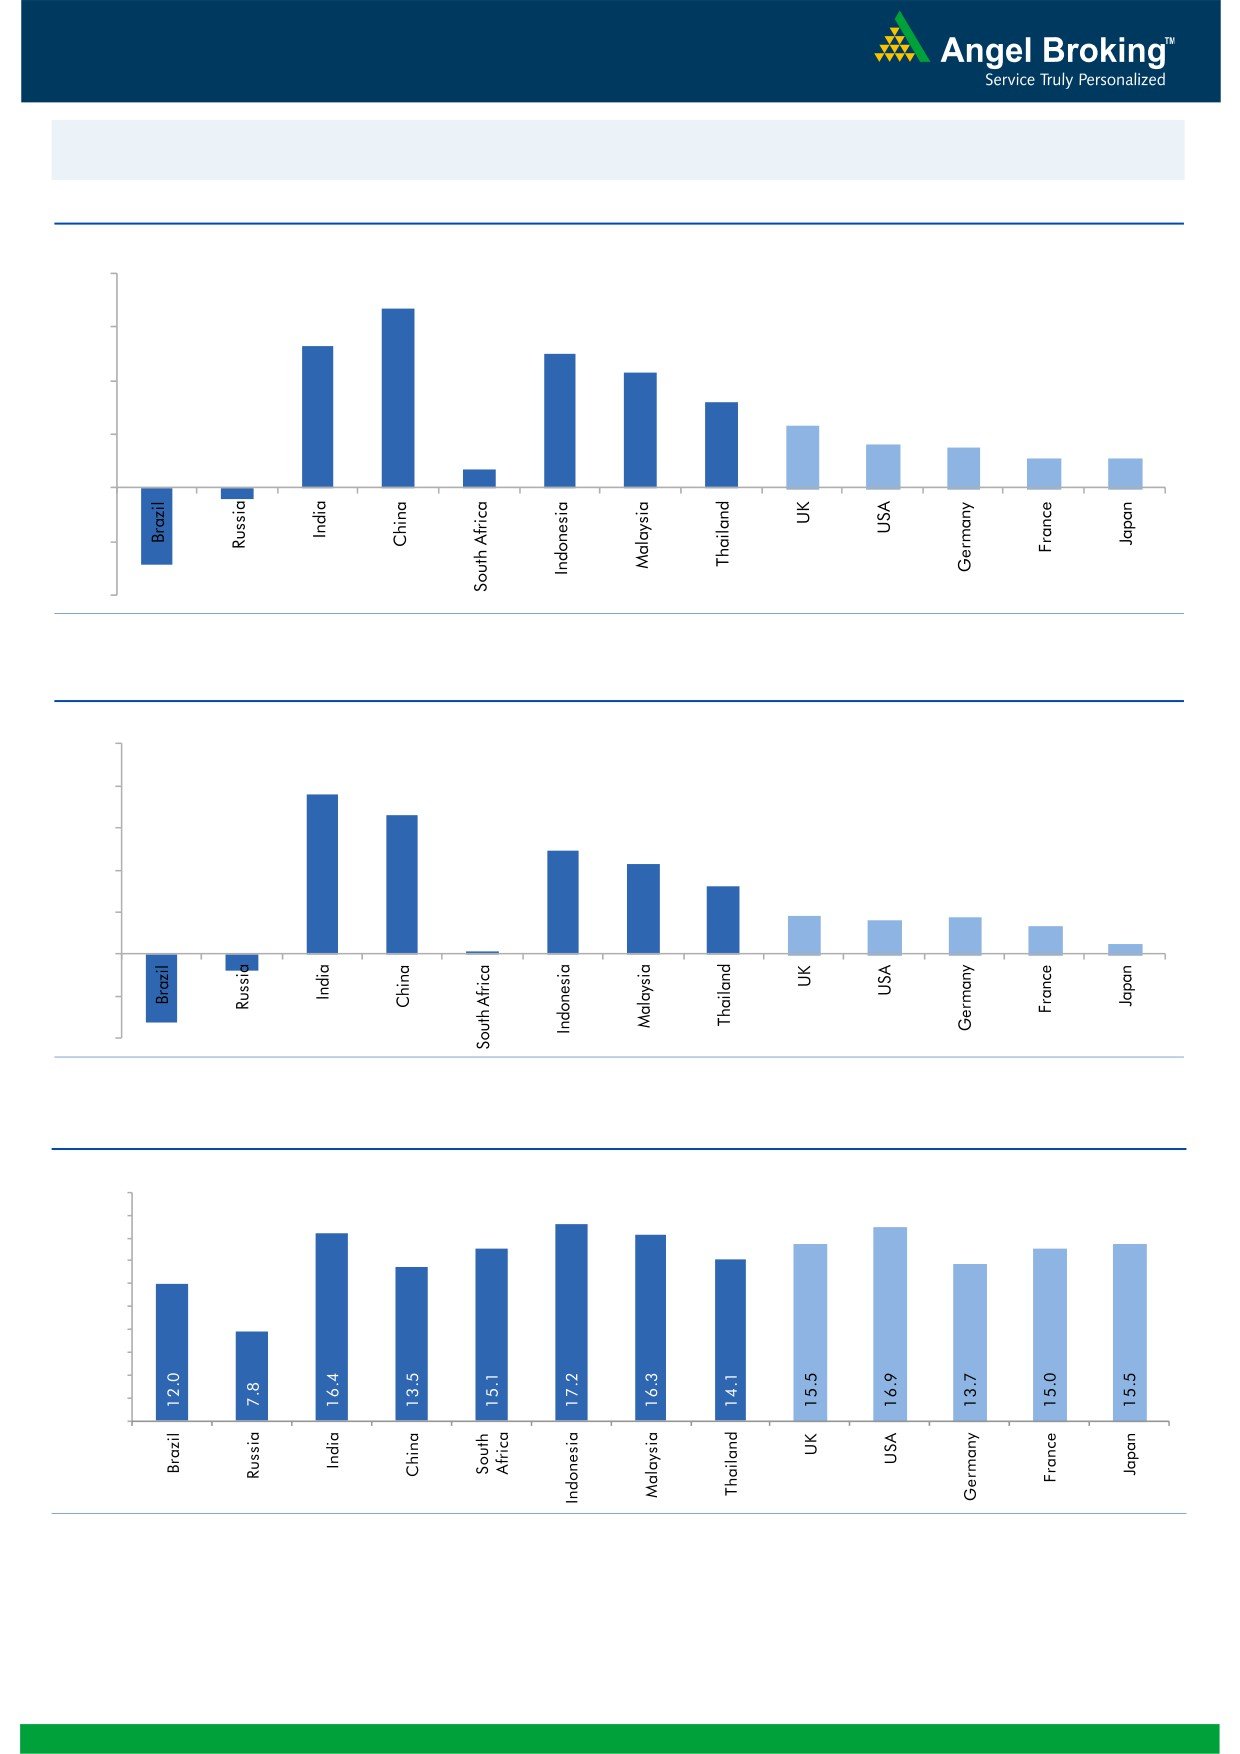
Global watch
Exhibit 1: Latest quarterly GDP Growth (%, yoy) across select developing and developed countries
(%)
8.0
6.7
5.3
6.0
5.0
0.7
4.3
4.0
3.2
2.3
1.6
1.5
2.0
1.1
1.1
-
(2.0)
(0.4)
(2.9)
(4.0)
Source: Bloomberg, Angel Research
Exhibit 2: 2016 GDP Growth projection by IMF (%, yoy) across select developing and developed countries
(%)
10.0
7.6
8.0
6.6
6.0
4.9
4.3
4.0
3.2
1.8
1.7
1.6
1.3
2.0
(0.8)
0.5
(3.3)
0.1
-
(2.0)
(4.0)
Source: IMF, Angel Research
Exhibit 3: One year forward P-E ratio across select developing and developed countries
(x)
20.0
18.0
16.0
14.0
12.0
10.0
8.0
6.0
4.0
2.0
-
Source: IMF, Angel Research
Market Outlook
December 20, 2016
Exhibit 4: Relative performance of indices across globe
Returns (%)
Country
Name of index
Closing price
1M
3M
1YR
Brazil
Bovespa
57,111
(4.4)
(1.4)
27.6
Russia
Micex
2,216
8.5
11.5
24.4
India
Nifty
8,104
0.3
(7.3)
6.5
China
Shanghai Composite
3,118
(2.6)
2.9
(10.0)
South Africa
Top 40
43,332
(0.6)
(4.8)
(3.5)
Mexico
Mexbol
44,895
(0.3)
(1.9)
4.6
Indonesia
LQ45
865
(1.0)
(5.9)
12.3
Malaysia
KLCI
1,634
0.4
(1.1)
(0.9)
Thailand
SET 50
948
3.0
1.7
10.8
USA
Dow Jones
19,883
5.4
9.7
15.3
UK
FTSE
7,017
3.3
2.7
15.4
Japan
Nikkei
19,392
8.6
15.9
0.5
Germany
DAX
11,427
6.9
10.1
8.9
France
CAC
4,823
6.5
9.9
2.6
Source: Bloomberg, Angel Research
Stock Watch
December 20, 2016
Company Name
Reco
CMP
Target
Mkt Cap
Sales ( Čcr )
OPM(%)
EPS (Č)
PER(x)
P/BV(x)
RoE(%)
EV/Sales(x)
(Č)
Price ( Č)
( Č cr )
FY17E FY18E
FY17E
FY18E
FY17E
FY18E
FY17E
FY18E
FY17E
FY18E
FY17E
FY18E
FY17E
FY18E
Agri / Agri Chemical
Rallis
Neutral
200
-
3,892
1,937
2,164
13.3
14.3
9.0
11.0
22.2
18.2
3.9
3.4
18.4
19.8
2.1
1.8
United Phosphorus
Accumulate
641
684
32,518
15,176
17,604
18.5
18.5
37.4
44.6
17.2
14.4
3.4
2.8
21.4
21.2
2.3
1.9
Auto & Auto Ancillary
Ashok Leyland
Buy
79
111
22,426
22,407
26,022
10.6
10.6
5.2
6.4
15.1
12.3
3.4
2.9
23.6
24.7
1.1
0.9
Bajaj Auto
Neutral
2,646
-
76,575
25,093
27,891
19.5
19.2
143.9
162.5
18.4
16.3
5.2
4.4
30.3
29.4
2.8
2.4
Bharat Forge
Neutral
969
-
22,550
7,726
8,713
20.5
21.2
35.3
42.7
27.4
22.7
5.1
4.6
18.9
20.1
3.0
2.6
Eicher Motors
Neutral
21,601
-
58,762
16,583
20,447
17.5
18.0
598.0
745.2
36.1
29.0
12.3
9.4
41.2
38.3
3.4
2.7
Gabriel India
Buy
108
130
1,556
1,544
1,715
9.0
9.3
5.4
6.3
20.1
17.2
3.8
3.4
18.9
19.5
1.0
0.9
Hero Motocorp
Accumulate
3,106
3,541
62,018
30,958
34,139
15.7
15.7
193.6
208.3
16.0
14.9
6.3
5.2
34.2
30.5
1.9
1.7
Jamna Auto Industries Neutral
167
-
1,328
1,486
1,620
9.8
9.9
15.0
17.2
11.1
9.7
2.4
2.1
21.8
21.3
1.0
0.9
L G Balakrishnan & Bros Neutral
590
-
927
1,302
1,432
11.6
11.9
43.7
53.0
13.5
11.1
1.9
1.7
13.8
14.2
0.8
0.7
Mahindra and Mahindra Neutral
1,176
-
73,047
46,534
53,077
11.6
11.7
67.3
78.1
17.5
15.1
2.8
2.5
15.4
15.8
1.5
1.3
Maruti
Buy
5,120
6,006
154,668
68,057
82,958
15.8
15.5
212.1
261.2
24.1
19.6
4.8
4.0
19.8
20.3
2.0
1.5
Minda Industries
Neutral
319
-
2,533
2,728
3,042
9.0
9.1
68.2
86.2
4.7
3.7
1.1
0.8
23.8
24.3
1.0
0.9
Motherson Sumi
Neutral
320
-
44,909
45,896
53,687
7.8
8.3
13.0
16.1
24.5
19.9
7.9
6.3
34.7
35.4
1.1
0.9
Rane Brake Lining
Neutral
975
-
772
511
562
11.3
11.5
28.1
30.9
34.7
31.5
5.3
4.8
15.3
15.0
1.7
1.5
Setco Automotive
Neutral
38
-
504
741
837
13.0
13.0
15.2
17.0
2.5
2.2
0.4
0.4
15.8
16.3
1.1
1.0
Tata Motors
Neutral
472
-
136,189
300,209
338,549
8.9
8.4
42.7
54.3
11.1
8.7
1.8
1.5
15.6
17.2
0.6
0.5
TVS Motor
Neutral
375
-
17,813
13,390
15,948
6.9
7.1
12.8
16.5
29.4
22.7
7.3
5.8
26.3
27.2
1.4
1.1
Amara Raja Batteries
Buy
899
1,167
15,361
5,504
6,605
17.6
17.5
33.4
40.9
26.9
22.0
5.9
4.8
22.1
22.0
2.8
2.3
Exide Industries
Neutral
175
-
14,884
7,439
8,307
15.0
15.0
8.1
9.3
21.6
18.8
3.0
2.7
14.3
16.7
1.6
1.4
Apollo Tyres
Buy
195
235
9,934
12,877
14,504
14.3
13.9
21.4
23.0
9.1
8.5
1.4
1.2
16.4
15.2
0.9
0.9
Ceat
Buy
1,253
1,450
5,069
7,524
8,624
13.0
12.7
131.1
144.3
9.6
8.7
1.8
1.5
19.8
18.6
0.8
0.7
JK Tyres
Neutral
115
-
2,614
7,455
8,056
15.0
15.0
21.8
24.5
5.3
4.7
1.1
0.9
22.8
21.3
0.5
0.4
Swaraj Engines
Neutral
1,360
-
1,689
660
810
15.2
16.4
54.5
72.8
25.0
18.7
7.8
7.1
31.5
39.2
2.4
1.9
Subros
Neutral
159
-
956
1,488
1,681
11.7
11.9
6.4
7.2
24.9
22.2
2.6
2.4
10.8
11.4
0.9
0.8
Indag Rubber
Neutral
181
-
475
286
326
19.8
16.8
11.7
13.3
15.5
13.6
2.6
2.4
17.8
17.1
1.3
1.2
Capital Goods
ACE
Neutral
48
-
474
709
814
4.1
4.6
1.4
2.1
34.2
22.8
1.4
1.3
4.4
6.0
0.8
0.7
BEML
Neutral
915
-
3,810
3,451
4,055
6.3
9.2
31.4
57.9
29.1
15.8
1.8
1.6
6.3
10.9
1.2
1.0
Bharat Electronics
Neutral
1,440
-
32,154
8,137
9,169
16.8
17.2
58.7
62.5
24.5
23.0
3.8
3.4
44.6
46.3
2.9
2.6
Stock Watch
December 20, 2016
Company Name
Reco
CMP
Target
Mkt Cap
Sales ( Čcr )
OPM(%)
EPS (Č)
PER(x)
P/BV(x)
RoE(%)
EV/Sales(x)
(Č)
Price ( Č)
( Č cr )
FY17E
FY18E
FY17E
FY18E
FY17E
FY18E
FY17E
FY18E
FY17E
FY18E
FY17E
FY18E
FY17E
FY18E
Capital Goods
Voltas
Buy
318
407
10,516
6,511
7,514
7.9
8.7
12.9
16.3
24.6
19.5
4.4
3.9
16.7
18.5
1.4
1.2
BGR Energy
Neutral
114
-
823
16,567
33,848
6.0
5.6
7.8
5.9
14.6
19.3
0.8
0.8
4.7
4.2
0.2
0.1
BHEL
Neutral
122
-
29,751
28,797
34,742
-
2.8
2.3
6.9
52.9
17.6
0.9
0.9
1.3
4.8
0.7
0.5
Blue Star
Buy
457
634
4,365
4,283
5,077
5.9
7.3
14.9
22.1
30.7
20.7
6.0
5.0
20.4
26.4
1.1
0.9
Crompton Greaves
Neutral
59
-
3,688
5,777
6,120
5.9
7.0
3.3
4.5
17.8
13.1
0.8
0.8
4.4
5.9
0.6
0.5
Greaves Cotton
Neutral
122
-
2,983
1,755
1,881
16.8
16.9
7.8
8.5
15.7
14.4
3.1
2.9
20.6
20.9
1.4
1.3
Inox Wind
Neutral
198
-
4,385
5,605
6,267
15.7
16.4
24.8
30.0
8.0
6.6
2.2
1.6
25.9
24.4
0.8
0.7
KEC International
Neutral
135
-
3,469
9,294
10,186
7.9
8.1
9.9
11.9
13.6
11.3
2.0
1.7
15.6
16.3
0.6
0.5
Thermax
Neutral
815
-
9,709
5,421
5,940
7.3
7.3
25.7
30.2
31.7
27.0
3.8
3.5
12.2
13.1
1.7
1.5
VATech Wabag
Buy
464
681
2,534
3,136
3,845
8.9
9.1
26.0
35.9
17.9
12.9
2.2
1.9
13.4
15.9
0.7
0.6
Cement
ACC
Neutral
1,279
-
24,012
11,225
13,172
13.2
16.9
44.5
75.5
28.7
16.9
2.7
2.5
11.2
14.2
2.1
1.8
Ambuja Cements
Neutral
201
-
39,911
9,350
10,979
18.2
22.5
5.8
9.5
34.7
21.2
2.9
2.6
10.2
12.5
4.3
3.6
India Cements
Neutral
111
-
3,413
4,364
4,997
18.5
19.2
7.9
11.3
14.1
9.8
1.0
1.0
8.0
8.5
1.5
1.3
JK Cement
Neutral
680
-
4,753
4,398
5,173
15.5
17.5
31.2
55.5
21.8
12.3
2.6
2.3
12.0
15.5
1.6
1.3
J K Lakshmi Cement
Buy
337
565
3,964
2,913
3,412
14.5
19.5
7.5
22.5
44.9
15.0
2.8
2.3
12.5
18.0
1.9
1.6
Orient Cement
Buy
125
215
2,558
2,114
2,558
18.5
20.5
8.1
11.3
15.4
11.1
2.3
1.9
9.0
14.0
1.8
1.4
UltraTech Cement
Neutral
3,108
-
85,304
25,768
30,385
21.0
23.5
111.0
160.0
28.0
19.4
3.6
3.1
13.5
15.8
3.4
2.8
Construction
ITNL
Neutral
107
-
3,518
8,946
10,017
31.0
31.6
8.1
9.1
13.2
11.8
0.5
0.5
4.2
5.0
3.7
3.5
KNR Constructions
Buy
174
802
2,447
1,385
1,673
14.7
14.0
41.2
48.5
4.2
3.6
0.8
0.7
14.9
15.2
1.8
1.5
Larsen & Toubro
Buy
1,345
1,634
125,454
111,017
124,908
11.0
11.0
61.1
66.7
22.0
20.2
2.6
2.5
13.1
12.9
2.2
2.0
Gujarat Pipavav Port
Neutral
137
-
6,618
705
788
52.2
51.7
5.0
5.6
27.4
24.5
2.7
2.4
11.2
11.2
9.0
7.6
Nagarjuna Const.
Neutral
82
-
4,542
8,842
9,775
9.1
8.8
5.3
6.4
15.4
12.8
1.2
1.1
8.2
9.1
0.7
0.6
PNC Infratech
Buy
105
143
2,705
2,350
2,904
13.1
13.2
9.0
8.8
11.7
12.0
0.4
0.4
15.9
13.9
1.3
1.0
Simplex Infra
Neutral
280
-
1,384
6,829
7,954
10.5
10.5
31.4
37.4
8.9
7.5
0.9
0.9
9.9
13.4
0.6
0.5
Power Mech Projects
Neutral
460
-
677
1,801
2,219
12.7
14.6
72.1
113.9
6.4
4.0
1.2
1.0
16.8
11.9
0.4
0.3
Sadbhav Engineering
Accumulate
271
298
4,654
3,598
4,140
10.3
10.6
9.0
11.9
30.1
22.8
3.2
2.8
9.9
11.9
1.6
1.3
NBCC
Neutral
224
-
13,431
7,428
9,549
7.9
8.6
8.2
11.0
27.3
20.4
1.4
1.1
28.2
28.7
1.5
1.1
MEP Infra
Neutral
38
-
616
1,877
1,943
30.6
29.8
3.0
4.2
12.6
9.0
6.1
4.1
0.6
0.6
1.7
1.5
SIPL
Neutral
102
-
3,586
1,036
1,252
65.5
66.2
(8.4)
(5.6)
3.8
4.4
(22.8)
(15.9)
11.7
9.7
Stock Watch
December 20, 2016
Company Name
Reco
CMP
Target
Mkt Cap
Sales ( Čcr )
OPM(%)
EPS (Č)
PER(x)
P/BV(x)
RoE(%)
EV/Sales(x)
(Č)
Price ( Č)
( Č cr )
FY17E
FY18E
FY17E
FY18E
FY17E
FY18E
FY17E
FY18E
FY17E
FY18E
FY17E
FY18E
FY17E
FY18E
Construction
Engineers India
Neutral
316
-
10,647
1,725
1,935
16.0
19.1
11.4
13.9
27.7
22.7
3.8
3.7
13.4
15.3
5.1
4.6
Financials
Axis Bank
Buy
468
630
111,787
46,932
53,575
3.5
3.4
32.4
44.6
14.5
10.5
1.9
1.6
13.6
16.5
-
-
Bank of Baroda
Neutral
159
-
36,705
19,980
23,178
1.8
1.8
11.5
17.3
13.9
9.2
1.6
1.3
8.3
10.1
-
-
Canara Bank
Neutral
298
-
16,176
15,225
16,836
1.8
1.8
14.5
28.0
20.5
10.6
1.4
1.2
5.8
8.5
-
-
Dewan Housing Finance Buy
242
350
7,564
2,225
2,688
2.9
2.9
29.7
34.6
8.1
7.0
1.3
1.1
16.1
16.8
-
-
Equitas Holdings
Buy
151
235
5,074
939
1,281
11.7
11.5
5.8
8.2
26.1
18.5
2.2
2.0
10.9
11.5
-
-
Federal Bank
Neutral
68
-
11,692
9,353
10,623
2.9
2.9
4.4
5.8
15.4
11.7
1.5
1.3
9.5
11.0
-
-
HDFC
Neutral
1,250
-
197,848
11,475
13,450
3.4
3.4
45.3
52.5
27.6
23.8
5.3
4.7
20.2
20.5
-
-
HDFC Bank
Accumulate
1,177
1,350
300,411
46,097
55,433
4.5
4.5
58.4
68.0
20.2
17.3
3.5
3.0
18.8
18.6
-
-
ICICI Bank
Buy
257
315
149,692
42,800
44,686
3.1
3.3
18.0
21.9
14.3
11.7
1.9
1.8
11.1
12.3
-
-
Lakshmi Vilas Bank
Buy
143
174
2,561
3,339
3,799
2.7
2.8
11.0
14.0
13.0
10.2
1.4
1.2
11.2
12.7
-
-
LIC Housing Finance
Accumulate
548
630
27,676
3,712
4,293
2.6
2.5
39.0
46.0
14.1
11.9
2.6
2.3
19.9
20.1
-
-
Punjab Natl.Bank
Neutral
124
-
26,472
23,532
23,595
2.3
2.4
6.8
12.6
18.3
9.9
2.8
2.0
3.3
6.5
-
-
RBL Bank
Neutral
346
-
12,808
1,783
2,309
2.6
2.6
12.7
16.4
27.3
21.1
3.0
2.7
12.8
13.3
-
-
South Ind.Bank
Neutral
21
-
2,825
6,435
7,578
2.5
2.5
2.7
3.1
7.7
6.7
1.0
0.8
10.1
11.2
-
-
St Bk of India
Neutral
261
-
202,919
88,650
98,335
2.6
2.6
13.5
18.8
19.4
13.9
1.8
1.6
7.0
8.5
-
-
Union Bank
Neutral
134
-
9,177
13,450
14,925
2.3
2.3
25.5
34.5
5.2
3.9
0.8
0.7
7.5
10.2
-
-
Yes Bank
Neutral
1,181
-
49,918
8,978
11,281
3.3
3.4
74.0
90.0
16.0
13.1
3.0
2.6
17.0
17.2
-
-
FMCG
Asian Paints
Neutral
880
-
84,381
17,128
18,978
16.8
16.4
19.1
20.7
46.1
42.5
16.0
15.1
34.8
35.5
4.8
4.4
Britannia
Buy
2,894
3,626
34,732
9,594
11,011
14.6
14.9
80.3
94.0
36.0
30.8
14.8
11.4
41.2
-
3.5
3.0
Colgate
Accumulate
909
995
24,723
4,605
5,149
23.4
23.4
23.8
26.9
38.2
33.8
21.1
16.5
64.8
66.8
5.3
4.7
Dabur India
Accumulate
269
304
47,367
8,315
9,405
19.8
20.7
8.1
9.2
33.2
29.2
9.2
7.7
31.6
31.0
5.3
4.7
GlaxoSmith Con*
Neutral
5,038
-
21,186
4,350
4,823
21.2
21.4
179.2
196.5
28.1
25.6
7.5
6.3
27.1
26.8
4.3
3.8
Godrej Consumer
Neutral
1,450
-
49,394
10,235
11,428
18.4
18.6
41.1
44.2
35.3
32.8
7.8
6.6
24.9
24.8
4.9
4.3
HUL
Neutral
811
-
175,523
35,252
38,495
17.8
17.8
20.7
22.4
39.3
36.2
37.5
32.2
95.6
88.9
4.8
4.4
ITC
Buy
227
284
275,231
40,059
44,439
38.3
39.2
9.0
10.1
25.3
22.4
7.1
6.2
27.8
27.5
6.4
5.7
Marico
Buy
250
300
32,270
6,430
7,349
18.8
19.5
6.4
7.7
39.1
32.5
11.8
9.9
33.2
32.5
4.8
4.2
Nestle*
Neutral
6,019
-
58,036
10,073
11,807
20.7
21.5
124.8
154.2
48.2
39.0
19.8
17.8
34.8
36.7
5.6
4.7
Tata Global
Neutral
124
-
7,845
8,675
9,088
9.8
9.8
7.4
8.2
16.8
15.2
1.9
1.8
7.9
8.1
0.8
0.8
Stock Watch
December 20, 2016
Company Name
Reco
CMP
Target
Mkt Cap
Sales ( Čcr )
OPM(%)
EPS (Č)
PER(x)
P/BV(x)
RoE(%)
EV/Sales(x)
(Č)
Price ( Č)
( Č cr )
FY17E FY18E
FY17E
FY18E
FY17E
FY18E
FY17E
FY18E
FY17E
FY18E
FY17E
FY18E
FY17E
FY18E
FMCG
Procter & Gamble
Accumulate
6,900
7,369
22,398
2,939
3,342
23.2
23.0
146.2
163.7
47.2
42.2
105.7
101.3
25.3
23.5
7.2
6.2
Hygiene
IT
HCL Tech^
Buy
825
1,000
116,382
49,242
57,168
20.5
20.5
55.7
64.1
14.8
12.9
3.0
2.3
20.3
17.9
2.2
1.8
Infosys
Buy
1,002
1,249
230,200
68,350
77,326
27.0
27.0
62.5
69.4
16.0
14.4
3.4
3.1
21.3
21.6
2.8
2.4
TCS
Accumulate
2,288
2,620
450,735
119,025
133,308
27.6
27.6
131.2
145.5
17.4
15.7
5.7
5.2
32.4
33.1
3.6
3.1
Tech Mahindra
Buy
474
600
46,075
29,673
32,937
15.5
17.0
32.8
39.9
14.4
11.9
2.8
2.5
19.6
20.7
1.3
1.1
Wipro
Buy
463
590
112,561
55,440
60,430
18.1
18.1
35.9
39.9
12.9
11.6
2.3
2.1
19.0
19.3
1.7
1.6
Media
D B Corp
Neutral
353
-
6,490
2,297
2,590
27.4
28.2
21.0
23.4
16.8
15.1
3.9
3.4
23.7
23.1
2.6
2.3
HT Media
Neutral
72
-
1,669
2,693
2,991
12.6
12.9
7.9
9.0
9.1
8.0
0.8
0.7
7.8
8.3
0.2
0.1
Jagran Prakashan
Buy
169
225
5,525
2,355
2,635
28.0
28.0
10.8
12.5
15.6
13.5
3.4
2.9
21.7
21.7
2.4
2.1
Sun TV Network
Neutral
485
-
19,131
2,850
3,265
70.1
71.0
26.2
30.4
18.5
16.0
4.7
4.2
24.3
25.6
6.3
5.4
Hindustan Media
Neutral
270
-
1,982
1,016
1,138
24.3
25.2
27.3
30.1
9.9
9.0
1.9
1.7
16.2
15.8
1.3
1.1
Ventures
TV Today Network
Buy
263
385
1,566
637
743
27.5
27.5
18.4
21.4
14.3
12.3
2.5
2.1
17.4
17.2
2.1
1.7
Metals & Mining
Coal India
Neutral
288
-
178,587
84,638
94,297
21.4
22.3
24.5
27.1
11.7
10.6
4.9
4.7
42.6
46.0
1.6
1.5
Hind. Zinc
Neutral
270
-
114,189
14,252
18,465
55.9
48.3
15.8
21.5
17.1
12.6
2.8
2.4
17.0
20.7
8.0
6.2
Hindalco
Neutral
169
-
34,967
107,899
112,095
7.4
8.2
9.2
13.0
18.4
13.0
0.9
0.8
4.8
6.6
0.9
0.8
JSW Steel
Neutral
1,602
-
38,723
53,201
58,779
16.1
16.2
130.6
153.7
12.3
10.4
1.7
1.4
14.0
14.4
1.5
1.3
NMDC
Neutral
128
-
40,514
6,643
7,284
44.4
47.7
7.1
7.7
18.0
16.6
1.6
1.5
8.8
9.2
3.9
3.5
SAIL
Neutral
52
-
21,580
47,528
53,738
(0.7)
2.1
(1.9)
2.6
20.1
0.6
0.5
(1.6)
3.9
1.3
1.2
Vedanta
Neutral
227
-
67,373
71,744
81,944
19.2
21.7
13.4
20.1
17.0
11.3
1.5
1.3
8.4
11.3
1.3
1.0
Tata Steel
Neutral
411
-
39,917
121,374
121,856
7.2
8.4
18.6
34.3
22.1
12.0
1.4
1.3
6.1
10.1
1.0
0.9
Oil & Gas
Cairn India
Neutral
254
-
47,675
9,127
10,632
4.3
20.6
8.8
11.7
28.9
21.7
0.9
0.9
3.3
4.2
6.7
5.6
GAIL
Neutral
425
-
53,885
56,220
65,198
9.3
10.1
27.1
33.3
15.7
12.8
1.4
1.3
9.3
10.7
1.1
1.0
ONGC
Neutral
201
-
258,525
137,222
152,563
15.0
21.8
19.5
24.1
10.3
8.4
0.9
0.8
8.5
10.1
2.2
1.9
Indian Oil Corp
Neutral
305
-
148,129
373,359
428,656
5.9
5.5
54.0
59.3
5.7
5.1
0.9
0.8
16.0
15.6
0.6
0.5
Reliance Industries
Neutral
1,062
-
344,518
301,963
358,039
12.1
12.6
87.7
101.7
12.1
10.4
1.2
1.1
10.7
11.3
1.6
1.3
Pharmaceuticals
Alembic Pharma
Neutral
622
-
11,733
3,483
4,083
20.2
21.4
24.3
30.4
25.6
20.5
5.8
4.7
25.5
25.3
3.3
2.7
Alkem Laboratories Ltd
Buy
1,632
1,989
19,513
6,043
6,893
18.7
19.3
80.5
88.8
20.3
18.4
4.5
3.7
22.3
20.3
3.2
2.7
Aurobindo Pharma
Buy
700
877
40,936
15,720
18,078
23.7
23.7
41.4
47.3
16.9
14.8
4.4
3.4
29.6
26.1
2.8
2.4
Sanofi India*
Neutral
4,305
-
9,914
2,277
2,597
17.3
18.3
149.4
172.0
28.8
25.0
4.8
3.9
25.1
28.8
4.0
3.3
Stock Watch
December 20, 2016
Company Name
Reco
CMP
Target
Mkt Cap
Sales ( Čcr )
OPM(%)
EPS (Č)
PER(x)
P/BV(x)
RoE(%)
EV/Sales(x)
(Č)
Price ( Č)
( Č cr )
FY17E FY18E
FY17E
FY18E
FY17E
FY18E
FY17E
FY18E
FY17E
FY18E
FY17E
FY18E
FY17E
FY18E
Pharmaceuticals
Cadila Healthcare
Accumulate
372
400
38,114
10,429
12,318
22.6
22.0
16.9
19.2
22.0
19.4
5.6
4.5
28.5
25.7
3.7
3.0
Cipla
Reduce
568
490
45,719
15,378
18,089
17.4
18.4
21.6
27.2
26.3
20.9
3.4
3.0
13.7
15.2
3.2
2.6
Dr Reddy's
Neutral
3,074
-
50,926
16,043
18,119
20.8
22.4
112.4
142.9
27.4
21.5
3.7
3.2
14.1
15.9
3.1
2.8
Dishman Pharma
Neutral
212
-
3,427
1,718
1,890
22.7
22.8
9.5
11.3
22.4
18.8
2.2
2.0
10.1
10.9
2.5
2.1
GSK Pharma*
Neutral
2,699
-
22,865
3,000
3,312
15.4
20.6
46.5
60.8
58.1
44.4
13.9
13.9
26.3
30.6
7.4
6.7
Indoco Remedies
Reduce
260
240
2,392
1,112
1,289
16.2
18.2
11.6
16.0
22.4
16.2
3.6
3.0
17.0
20.1
2.3
1.9
Ipca labs
Accumulate
536
613
6,763
3,303
3,799
15.3
15.3
17.3
19.7
31.0
27.2
2.7
2.5
9.1
9.4
2.2
1.9
Lupin
Buy
1,475
1,809
66,559
15,912
18,644
26.4
26.7
58.1
69.3
25.4
21.3
4.9
4.1
21.4
20.9
4.3
3.5
Sun Pharma
Buy
632
847
151,678
31,129
35,258
32.0
32.9
30.2
35.3
20.9
17.9
3.4
2.8
20.0
20.1
4.4
3.7
Power
Tata Power
Neutral
77
-
20,866
36,916
39,557
17.4
27.1
5.1
6.3
15.1
12.3
1.3
1.2
9.0
10.3
1.6
1.4
NTPC
Neutral
160
-
132,134
86,605
95,545
17.5
20.8
11.8
13.4
13.6
12.0
1.4
1.3
10.5
11.1
2.9
2.9
Power Grid
Buy
184
223
96,340
25,315
29,193
88.2
88.7
14.2
17.2
13.0
10.7
2.0
1.7
15.2
16.1
8.5
7.6
Real Estate
MLIFE
Buy
361
522
1,481
1,152
1,300
22.7
24.6
29.9
35.8
12.1
10.1
0.9
0.8
7.6
8.6
2.0
1.7
Telecom
Bharti Airtel
Neutral
305
-
121,961
105,086
114,808
34.5
34.7
12.2
16.4
25.0
18.6
1.7
1.6
6.8
8.4
2.1
1.8
Idea Cellular
Neutral
76
-
27,442
40,133
43,731
37.2
37.1
6.4
6.5
11.9
11.7
1.0
0.9
8.2
7.6
1.7
1.4
zOthers
Abbott India
Neutral
4,638
-
9,855
3,153
3,583
14.1
14.4
152.2
182.7
30.5
25.4
149.6
127.8
25.6
26.1
2.8
2.4
Bajaj Electricals
Buy
219
274
2,213
4,801
5,351
5.7
6.2
10.4
13.7
21.0
16.0
2.6
2.3
12.4
14.5
0.5
0.4
Finolex Cables
Neutral
408
-
6,239
2,883
3,115
12.0
12.1
14.2
18.6
28.7
21.9
15.3
13.4
15.8
14.6
1.9
1.7
Goodyear India*
Neutral
706
-
1,629
1,598
1,704
10.4
10.2
49.4
52.6
14.3
13.4
66.0
57.9
18.2
17.0
0.7
97.7
Hitachi
Neutral
1,425
-
3,875
2,081
2,433
8.8
8.9
33.4
39.9
42.7
35.7
34.4
28.7
22.1
21.4
1.9
1.6
Jyothy Laboratories
Neutral
358
-
6,502
1,440
2,052
11.5
13.0
8.5
10.0
42.1
35.8
10.2
9.4
18.6
19.3
4.8
3.3
Page Industries
Neutral
13,979
-
15,592
2,450
3,124
20.1
17.6
299.0
310.0
46.8
45.1
311.3
237.7
47.1
87.5
6.4
5.1
Relaxo Footwears
Neutral
409
-
4,916
2,085
2,469
9.2
8.2
7.6
8.0
54.1
51.5
21.0
17.9
17.9
18.8
2.4
2.1
Siyaram Silk Mills
Accumulate
1,219
1,605
1,143
1,733
1,948
11.6
11.7
96.6
114.7
12.6
10.6
1.9
1.7
15.3
15.7
0.9
0.8
Styrolution ABS India*
Neutral
585
-
1,029
1,440
1,537
9.2
9.0
40.6
42.6
14.4
13.7
36.8
33.5
12.3
11.6
0.7
0.6
TVS Srichakra
Neutral
3,204
-
2,453
2,304
2,614
13.7
13.8
231.1
266.6
13.9
12.0
360.0
283.5
33.9
29.3
1.1
0.9
HSIL
Neutral
280
-
2,027
2,384
2,515
15.8
16.3
15.3
19.4
18.3
14.5
18.2
15.7
7.8
9.3
1.0
0.9
Kirloskar Engines India
Neutral
325
-
4,701
2,554
2,800
9.9
10.0
10.5
12.1
31.0
26.9
13.0
12.2
10.7
11.7
1.5
1.3
Ltd
M M Forgings
Neutral
452
-
545
546
608
20.4
20.7
41.3
48.7
10.9
9.3
61.9
54.7
16.6
17.0
0.8
0.8
Stock Watch
December 20, 2016
Company Name
Reco
CMP
Target
Mkt Cap
Sales ( Čcr )
OPM(%)
EPS (Č)
PER(x)
P/BV(x)
RoE(%)
EV/Sales(x)
(Č)
Price ( Č)
( Č cr )
FY17E
FY18E
FY17E
FY18E
FY17E
FY18E
FY17E
FY18E
FY17E
FY18E
FY17E
FY18E
FY17E
FY18E
zOthers
Banco Products (India) Neutral
188
-
1,342
1,353
1,471
12.3
12.4
14.5
16.3
12.9
11.5
17.9
16.1
14.5
14.6
0.9
99.7
Competent Automobiles Neutral
168
-
103
1,137
1,256
3.1
2.7
28.0
23.6
6.0
7.1
32.3
29.2
14.3
11.5
0.1
0.1
Nilkamal
Neutral
1,300
-
1,939
1,995
2,165
10.7
10.4
69.8
80.6
18.6
16.1
74.3
64.5
16.6
16.5
1.0
0.8
Visaka Industries
Neutral
185
-
294
1,051
1,138
10.3
10.4
21.0
23.1
8.8
8.0
23.8
22.3
9.0
9.2
0.5
0.5
Transport Corporation of
Neutral
160
-
1,226
2,671
2,911
8.5
8.8
13.9
15.7
11.6
10.2
1.6
1.4
13.7
13.8
0.6
0.5
India
Elecon Engineering
Neutral
58
-
654
1,482
1,660
13.7
14.5
3.9
5.8
14.9
10.0
3.5
3.2
7.8
10.9
0.8
0.7
Surya Roshni
Neutral
184
-
807
3,342
3,625
7.8
7.5
17.3
19.8
10.7
9.3
20.2
16.2
10.5
10.8
0.5
0.5
MT Educare
Neutral
117
-
466
366
417
17.7
18.2
9.4
10.8
12.5
10.8
2.8
2.4
22.2
22.3
1.2
1.0
Radico Khaitan
Buy
114
147
1,517
1,667
1,824
13.0
13.2
6.7
8.2
17.2
13.9
1.6
1.4
9.0
10.2
1.3
1.2
Garware Wall Ropes
Neutral
614
-
1,344
873
938
14.3
14.3
35.2
37.5
17.5
16.4
3.1
2.6
17.5
15.9
1.5
1.3
Wonderla Holidays
Neutral
346
-
1,957
287
355
38.0
40.0
11.3
14.2
30.7
24.4
4.4
3.8
21.4
23.9
6.5
5.3
Linc Pen & Plastics
Neutral
231
-
342
382
420
9.3
9.5
13.5
15.7
17.2
14.7
2.9
2.5
17.1
17.3
1.0
0.9
The Byke Hospitality
Neutral
167
-
669
287
384
20.5
20.5
7.6
10.7
21.9
15.6
4.6
3.7
20.7
23.5
2.3
1.7
Interglobe Aviation
Neutral
833
-
30,103
21,122
26,005
14.5
27.6
110.7
132.1
7.5
6.3
45.0
32.2
168.5
201.1
1.4
1.1
Coffee Day Enterprises
Neutral
197
-
4,060
2,964
3,260
20.5
21.2
4.7
8.0
-
24.6
2.3
2.1
5.5
8.5
1.8
1.6
Ltd
Navneet Education
Neutral
109
-
2,597
1,062
1,147
24.0
24.0
6.1
6.6
17.9
16.5
3.7
3.3
20.6
19.8
2.5
2.3
Navkar Corporation
Buy
172
265
2,446
369
561
42.9
42.3
7.2
11.5
23.8
14.9
1.8
1.6
7.4
10.5
7.6
5.0
UFO Moviez
Neutral
405
-
1,119
619
685
33.2
33.4
30.0
34.9
13.5
11.6
1.9
1.6
13.8
13.9
1.5
1.2
VRL Logistics
Neutral
264
-
2,410
1,902
2,119
16.7
16.6
14.6
16.8
18.1
15.7
4.0
3.5
21.9
22.2
1.4
1.2
Team Lease Serv.
Neutral
896
-
1,532
3,229
4,001
1.5
1.8
22.8
32.8
39.4
27.3
4.2
3.7
10.7
13.4
0.4
0.3
S H Kelkar & Co.
Neutral
286
-
4,135
1,036
1,160
15.1
15.0
6.1
7.2
46.8
39.8
5.0
4.6
10.7
11.5
3.9
3.4
Quick Heal
Neutral
273
-
1,913
408
495
27.3
27.0
7.7
8.8
35.3
31.1
3.3
3.3
9.3
10.6
3.8
3.2
Narayana Hrudaya
Neutral
337
-
6,892
1,873
2,166
11.5
11.7
2.6
4.0
127.5
85.1
7.8
7.1
6.1
8.3
3.8
3.3
Manpasand Bever.
Neutral
553
-
3,166
836
1,087
19.6
19.4
16.9
23.8
32.8
23.2
3.9
3.4
12.0
14.8
3.5
2.6
Parag Milk Foods
Neutral
261
-
2,194
1,919
2,231
9.3
9.6
9.5
12.9
27.6
20.2
4.3
3.5
15.5
17.5
1.3
1.1
Mirza International
Buy
87
107
1,044
987
1,106
18.0
18.0
6.5
7.6
13.3
11.4
2.1
1.8
15.9
15.7
1.3
1.1
Asian Granito
Buy
223
351
671
1,071
1,182
12.1
12.4
12.7
16.0
17.5
14.0
1.7
1.5
9.5
10.7
0.9
0.8
Source: Company, Angel Research; Note: *December year end; #September year end; &October year end; Price as on December 19, 2016
Market Outlook
December 20, 2016
Research Team Tel: 022 - 39357800
DISCLAIMER
Angel Broking Private Limited (hereinafter referred to as “Angel”) is a registered Member of National Stock Exchange of India
Limited,Bombay Stock Exchange Limited and Metropolitan Stock Exchange Limited. It is also registered as a Depository Participant with
CDSL and Portfolio Manager with SEBI. It also has registration with AMFI as a Mutual Fund Distributor. Angel Broking Private Limited is a
registered entity with SEBI for Research Analyst in terms of SEBI (Research Analyst) Regulations, 2014 vide registration number
INH000000164. Angel or its associates has not been debarred/ suspended by SEBI or any other regulatory authority for accessing
/dealing in securities Market. Angel or its associates/analyst has not received any compensation / managed or
co-managed public offering of securities of the company covered by Analyst during the past twelve months.
This document is solely for the personal information of the recipient, and must not be singularly used as the basis of any investment
decision. Nothing in this document should be construed as investment or financial advice. Each recipient of this document should make
such investigations as they deem necessary to arrive at an independent evaluation of an investment in the securities of the companies
referred to in this document (including the merits and risks involved), and should consult their own advisors to determine the merits and
risks of such an investment.
Reports based on technical and derivative analysis center on studying charts of a stock's price movement, outstanding positions and
trading volume, as opposed to focusing on a company's fundamentals and, as such, may not match with a report on a company's
fundamentals. Investors are advised to refer the Fundamental and Technical Research Reports available on our website to evaluate the
contrary view, if any.
The information in this document has been printed on the basis of publicly available information, internal data and other reliable
sources believed to be true, but we do not represent that it is accurate or complete and it should not be relied on as such, as this
document is for general guidance only. Angel Broking Pvt. Limited or any of its affiliates/ group companies shall not be in any way
responsible for any loss or damage that may arise to any person from any inadvertent error in the information contained in this report.
Angel Broking Pvt. Limited has not independently verified all the information contained within this document. Accordingly, we cannot
testify, nor make any representation or warranty, express or implied, to the accuracy, contents or data contained within this document.
While Angel Broking Pvt. Limited endeavors to update on a reasonable basis the information discussed in this material, there may be
regulatory, compliance, or other reasons that prevent us from doing so.
This document is being supplied to you solely for your information, and its contents, information or data may not be reproduced,
redistributed or passed on, directly or indirectly.
Neither Angel Broking Pvt. Limited, nor its directors, employees or affiliates shall be liable for any loss or damage that may arise from
or in connection with the use of this information.